In a recent meeting with a client we had a long discussion about the risks his London based business faced. At the point I mentioned Fire Risk he became quite dismissive and told me he had never experienced a fire at any of the offices he has worked in and can’t remember any fires in the vicinity of his current office. Based on his perceptions he decided that Fire represented a very low risk to his business. It was a typical entrepreneurial analysis of Risk – “I have a view and unless you can show me data to disprove it then we will go with my gut”
I was curious to find some data to prove or disprove his theory, so when I got back to the office I spent some time on Google looking for ‘Office Fire Statistics London’ Or ‘Commercial Property Fires’ etc. Try as I may, I couldn’t find a report that gave me the data I was looking for. As an example the Department for Communities and Local Government publish the Quarterly Fire Statistics Monitor for England. This report is at a very high level and is nowhere near granular enough for what I needed (a Garden Shed fire is categorised the same as a warehouse, office, restaurant or shop fire) so as far as I could see it is impossible to answer the question ‘How many office fires were there in 2013?’ or ‘How many restaurants in London are affected by fire each year’. Perhaps this data is collated somewhere but it is certainly not easy for a business owner to find when they are sitting in a risk management workshop.
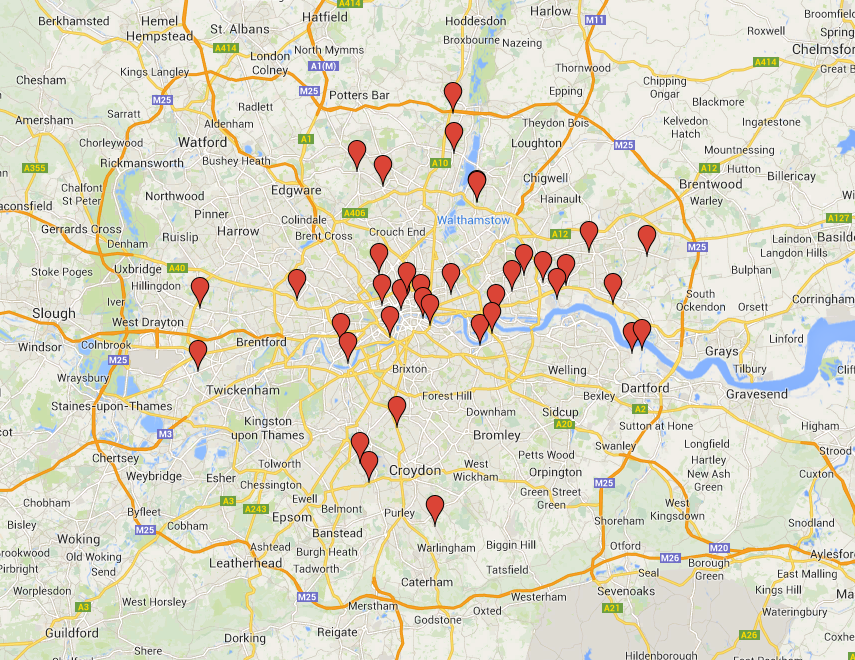
I can’t stand failing, so to answer the specific London question I turned to the London Fire Brigade website and through a combination of the reports in their Latest Incidents section and Twitter feed I quickly built up this London Fire Brigade Call Outs to Business Premises map. It probably isn’t perfect in terms of incidents as they may not have all been posted to the LFB web site or Twitter but it gives a pretty accurate representation of the location and frequency of commercial property fires and call outs in London. Unfortunately their website only keeps about 3 months of Incident history so the start date of the map is 1st May 2014. If you click on any of the map pins it will tell you about the type of call out and the date.
London Fire Map – since May 2014

London Fire Brigade Callouts to Business Premises – May-July 2014
Hopefully by working with the Fire Service, we will, in the future be able to help them categorise their call outs more accurately and take a live feed into our Crisis Management and Reporting platform – watch this space!


